Loading content
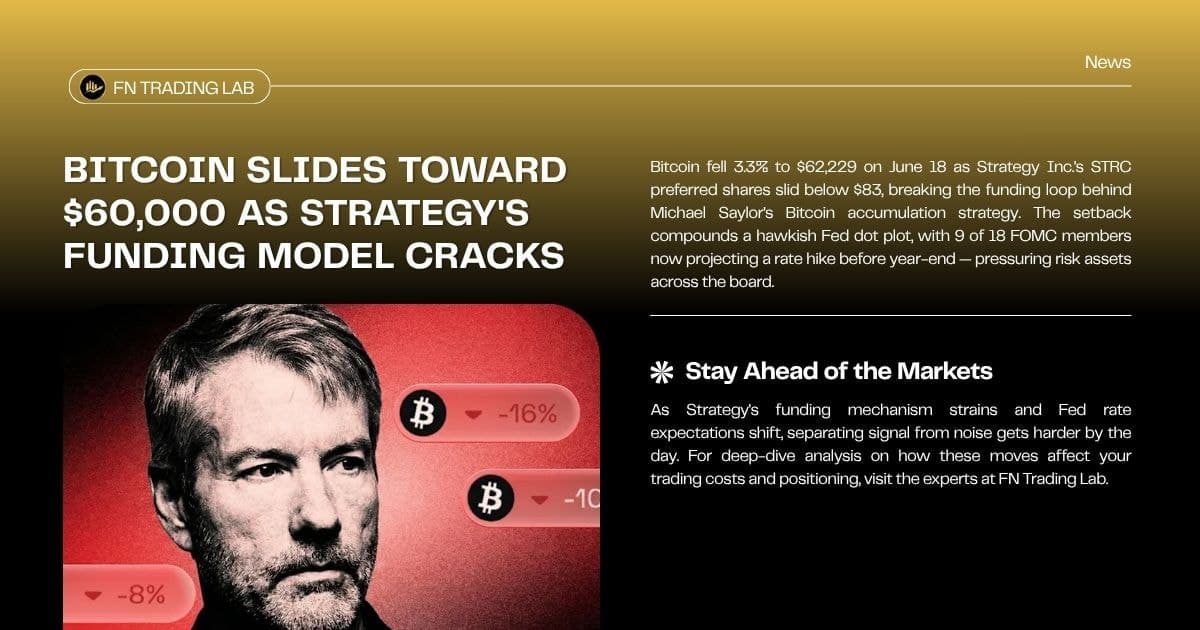
Bitcoin Slides Toward $60,000 as Strategy's Funding Model Cracks
Table of Contents
Quick Answer: Bitcoin fell 3.3% to $62,229 on June 18, 2026, as Strategy Inc.'s STRC preferred share mechanism broke down and the Federal Reserve's dot plot signaled rate hikes before year-end. Bitcoin already cracked below $60,000 two weeks ago — the first time since late 2024 — and that level is once again in the crosshairs.
Bitcoin is sliding toward $60,000 again, and this time the selling pressure has two distinct sources working in tandem. Strategy Inc.'s funding model — the engine that made the company the most visible institutional buyer of Bitcoin — is visibly stalling. Simultaneously, the Federal Reserve's June 2026 meeting delivered exactly the hawkish signal markets feared, sending rate-hike probabilities sharply higher. For traders, neither of these forces resolves quickly, and the $60,000 level is no longer theoretical.
What Happened#
On Thursday, June 18, 2026, Bitcoin fell as much as 3.3% to $62,229, extending a decline that had already pushed it below $60,000 two weeks earlier — the first breach of that threshold since late 2024. Since its record high in October 2025, Bitcoin has now lost roughly 50% of its value.
Two catalysts are converging simultaneously — the full numbers for each are in the table below.
Strategy's STRC breaks down. Strategy Inc. issued preferred shares known as "Stretch" (ticker: STRC) at a $100 par value, using the proceeds to fund additional Bitcoin purchases while paying holders a double-digit annual dividend. The mechanism only works when STRC trades at or above par — and it hasn't since May 15. At current levels, selling new STRC issuances to raise Bitcoin-buying capital is economically insolvent. Markets read Strategy's late-May share sale as a structural signal, not a one-off: it directly broke Michael Saylor's long-standing public pledge never to sell, and it comes as Strive's competing SATA preferred stock offers a 13.69% yield above par — actively pulling income-focused investors away from Strategy's product.
Fed dot plot turns hawkish. The Federal Reserve's June 17 decision to hold rates was no surprise — the dot plot was. The sharp jump in hike-probability pricing (see table) reflects a materially more hawkish Fed than markets expected as recently as May. This kind of rate repricing also tends to strengthen the US dollar broadly — see our breakdown of how the US Dollar Index affects every forex pair you trade for the mechanism behind that link.
Market Impact: Bitcoin and Crypto Under Double Pressure#
Rising rate expectations are structurally negative for Bitcoin. The asset generates no yield, so higher real interest rates widen the opportunity cost of holding it versus Treasuries or cash equivalents. When rate-hike probability spikes from 24% to 77% in a single month, the repricing of risk assets is immediate and mechanical.
The Strategy dimension goes beyond macro. For years, Strategy has been the world's most publicly committed institutional Bitcoin accumulator. When the funding vehicle behind that accumulation falters, and when the company's founder sells for the first time in three years, the market loses one of its most cited narratives for sustained institutional demand. Analysts at Benchmark and TD Cowen have pushed back on fears of a full "death spiral" for Strategy, but the damage to market psychology is already visible in the price action.
Bitcoin recovered from its May 2026 low of $59,130. But the recovery has been shallow. Every rally since that low has failed to reclaim ground convincingly, and both catalysts above remain active.
Key Catalysts at a Glance#
What Traders Should Watch#
Price action around the pivot levels in the table above. A second breach of $60,000 on high volume — rather than a brief wick — would suggest the May low of $59,130 was a waypoint, not a bottom.
Whether Strategy sells more BTC. Any additional sale, even a small one, would confirm the funding-model story is structural rather than a one-off headline.
Fed communications. New Fed Chair Kevin Warsh removed forward guidance entirely from his first press conference, leaving markets with less clarity than usual. His next public statements will carry outsized weight. Any softening on the rate-hike path would relieve significant pressure on risk assets including crypto. (Note: verify this detail independently — it falls outside what can be confirmed from training data.)
Iran deal as a potential tailwind. The US-Iran interim agreement signed June 19 is being cited as a possible near-term positive catalyst. If the deal holds and oil prices remain suppressed, the Fed's inflation calculus could shift — giving policymakers room to pause on hikes. Monitor energy markets for confirmation.
For traders managing positions through elevated volatility, keeping execution costs low compounds over time. Our breakdown of how forex rebates reduce your effective cost per trade is directly applicable here: when spreads widen and margin pressure rises, every dollar of cashback recovered from your broker matters more.
The Bottom Line#
Bitcoin faces a genuine double-catalyst drawdown: a broken institutional funding mechanism and a Fed signaling it may hike again before the year is out. The $60,000 level is the immediate risk threshold. The May low of $59,130 is the reference point if that breaks. Neither of the two driving forces — Strategy's STRC stress or the hawkish dot plot — shows signs of resolving in the near term.
For signals, tools, and resources to help navigate volatile market conditions, see our overview of the FN Trading Lab trading ecosystem.
Why This Setup Differs From Bitcoin's Prior Drawdowns#
Bitcoin has sold off sharply before — the 2022 bear market and the 2018 crash both saw drawdowns well beyond the roughly 50% decline described here from October 2025's high. What makes the current setup distinct isn't the magnitude of the drop so much as the source: this decline is being driven simultaneously by a structural crack in a specific, highly visible institutional buyer (Strategy) and a monetary-policy shift (the Fed's dot plot), rather than a single dominant cause. Past Bitcoin drawdowns have often been attributed primarily to leverage unwinds within the crypto market itself (exchange collapses, over-leveraged futures positions getting liquidated) — this one is notable for how much of the pressure is coming from outside crypto-native mechanics, through a publicly traded equity's balance sheet and a central bank's rate path.
Frequently Asked Questions #
This article is for informational purposes only and does not constitute financial advice. Trading involves significant risk of loss. Past performance is not indicative of future results. Please consult a qualified financial advisor before making any investment decisions.
FN Trading Lab - For Traders and Trading Community


Start earning rebates on every trade
Open an account with a top broker, or get a free 1-on-1 consultation from our team.

I'm Kelly Nguyen - a CFA, CMT, and MBA-qualified financial analyst and trading educator with over 6 years of hands-on experience in forex, commodities, and risk management. I started my career on the analytical side of institutional finance before shifting my focus to trading education, where I now help retail traders develop structured, disciplined approaches to the markets. At FN Trading Lab, I create content grounded in real market experience - no fluff, no hype. My goal is simple: make serious trading knowledge accessible to serious traders.
CFACMTMBA6+ Years Market Experience
Risk ManagementTechnical AnalysisForex TradingMarket StructureTrading PsychologyDerivatives



Exclusive